Introduction
The design of visual stimuli and materials has shifted in today’s information age from being a matter of aesthetic preference to serving as a fundamental element in the effective processing and transfer of information. In this context, color assumes a multifaceted role by directing attention, regulating cognitive load, and evoking emotional responses through its cognitive and psychological effects. Accordingly, how color shapes visual perception and manages attention mechanisms in visual learning environments has become a central research focus in educational design. In line with this perspective, the present study examines the effects of color on visual learning and perception using an eye-tracking approach.
Eye tracking in mathematics and geometry education
Eye tracking is a valuable method for determining where individuals focus their attention, providing insights into the effectiveness of learning materials. This technology allows researchers to analyze eye movements that are difficult to observe directly, such as the sequence and duration of a user's focus on specific areas (; ). Due to its effectiveness, it is widely used in mathematics education research (), with applications in various areas including numbers and operations (; ; ), mathematical representations (; ; ; ), learning disabilities (; ), problem solving (; ; ), and mathematical proof ().
Eye tracking is frequently used in geometry research, where visuals play a significant role (; ; ; ). This is attributed to the strong link between geometric thinking and visual perception (), as geometry integrates both visual and abstract logical thinking (). The eye-tracking approach is therefore highly valuable for geometry studies (; ). Research by shows that non-prototypical shapes lead to more eye movements, suggesting individuals first quickly recognize a shape before deciding on further analysis. Eye tracking is also effective in identifying student difficulties and misconceptions regarding geometric concepts (). Furthermore, eye movements reflect not only visual information focus but also how sensory-motor feedback relates to cultural contexts (), which can inform the design of more effective mathematics and geometry education materials ().
Color and visual perception in the learning process
While color is a perceptual characteristic based on visible wavelengths (). Its effects extend to individuals’ psychological states and cognitive processes. mention that colors are directly linked to emotions, significantly influencing mood and well-being. For instance, warm colors like red are associated with increased arousal and attention, whereas cool colors like blue are often linked to relaxation and satisfaction (; ). Furthermore, studies suggest that color perception can differ based on gender (; ).
The influence of color on perceptual processes is significant, often dominating other visual elements like shape (). Cognitively, processing colored images requires less effort and time than black-and-white images (), with some findings even suggesting that dark colors can facilitate perception (). The perception of an object is also influenced by environmental factors, such as background color and the harmony of color combinations (; ). These findings highlight the fundamental role of color in visual perception.
Written and visual stimuli are used intensively in education, making colors an important part of the learning process (). Colors are powerful visual elements that significantly enrich learning by influencing cognitive processes like perception, memory, and the recall of visual stimuli (). They guide emotional responses and affect cognitive activities such as information processing, recall, and association. Therefore, appropriate use of color can attract more attention and improve recall ().
Research indicates that colors have a significant effect on learning, as their intensive use in educational materials can positively impact cognitive processes. According to , associating text and visuals with colors enhances learning by facilitating information retention and the transfer of knowledge to long-term memory. Highlighting specific words with color can also improve reading and comprehension by providing visual cues (). Similarly, concluded that color coding and cues in learning content can significantly improve retention and transferability, thereby boosting learning performance. However, while colors can positively direct attention, they can also have a negative impact by distracting learners toward irrelevant elements (). Also, research indicates that red may have different effects on psychology and perception (), be more distracting than other colors (), and negatively impact learning performance depending on individual differences (). However, colors can also positively influence learning motivation. found that colors can evoke positive emotions like happiness and excitement. suggest that using colors such as blue, pink, and white —which create positive emotions and do not impose spatial constraints— can increase motivation for exploration and imagination, thereby improving learning efficiency. These findings emphasize the importance of careful color planning in educational materials to positively contribute to learning motivation.
Based on Mayer's () Multimedia Learning Theory, the effective use of color is essential for integrating visual and verbal information to optimize learning. Given that color can positively influence learning outcomes and offer new insights into cognitive psychology (), its deliberate and functional use in educational materials is a vital tool for improving learning quality and advancing the field.
In eye-tracking studies, color is a key feature that attracts attention and directs eye movements (; ). Research using this technology shows that colored cues reduce cognitive load by shortening learners' gaze duration, helping them select and organize information, and ultimately improving academic performance (; ; ; ). Specifically, color coding that links text and visuals in learning materials has been found to reduce distractions and increase information access speed, which positively affects learning performance and fixation time ().
Purpose and importance of research
This study investigated whether student success, number of fixations, and gaze durations differ by color combination when perceptually comparing the areas of rectangle pairs. This analysis was conducted across students at different Van Hiele Geometric Thinking levels (VHGTL) groups and grade levels, as VHGTL is directly related to geometry knowledge, and curriculum outcomes increase in higher grades. This approach is based on the strong link between geometric thinking and visual perception (), and the fact that geometry combines visual perception with abstract logical thinking (). Furthermore, colors are salient elements known to influence and direct perceptual processes (). While these connections are established, no previous study has examined their effects on the perception and evaluation of geometric shape areas presented with a colored background. The study's sample size is considered sufficient given its purpose, as similar eye-tracking studies with high-resolution process data and carefully controlled task conditions have employed comparable or smaller samples (e.g. , ).
Consequently, this study aims to shed light on students' visual perception processes and provide a novel example for research in geometry education. The research questions of the study are determined as:
-
Does success in perceptually comparing rectangle areas differ across item groups among students at different VHGTL groups and grade levels?
-
Do the number of fixations during area comparison differ across item groups among students at different VHGTL groups and grade levels?
-
Do gaze durations during area comparison differ across item groups among students at different VHGTL groups and grade levels?
In this study, success (accuracy of chosen rectangle) was chosen as a measure, consistent with previous research that identifies it as a key indicator of cognitive processing efficiency in visual comparison tasks (). Eye-tracking metrics were included to reflect attentional mechanisms: fixation count was used to show the distribution of visual attention, while gaze duration indicated processing time and cognitive engagement (; ). These variables are widely used in research to explore the relationship between visual attention and task performance ().
This study has significant theoretical and practical implications for the design of educational materials. The findings will provide data-driven insights for various stakeholders, including authorities who develop standardized tests. An analysis of student performance on questions with different color combinations can provide empirical guidance for creating more visually accessible and equitable assessments. The research's examination of eye-tracking metrics like fixations and gaze duration can also inform the creators of print and digital instructional content. By identifying how these metrics vary with different color schemes, designers can select combinations that optimize focus and enhance learning. At grade level, these results can empower educators to make research-backed decisions when selecting and designing teaching aids, ensuring that color facilitates rather than hinders student comprehension.
Method
Research design
The variables used in this study included: (1) success in perceptually comparing the areas of rectangle pairs, defined as the accuracy of participants’ verbal responses; (2) the number of fixations recorded by the eye-tracker for each item; and (3) the gaze duration, representing the total time participants visually attended to each stimulus group. The experimental design employed a within-subjects approach, where each participant was exposed to all nine item groups. The Visual Stimuli Form (VSF) was systematically constructed from nine predetermined item groups that varied in background-figure color combinations and rectangle area characteristics.
Participants
This study was conducted in two public middle schools located in a medium-sized province in Central Anatolia, Türkiye. A total of 50 students in the 5th, 6th, and 7th grades of middle school participated voluntarily, 28 females and 22 males, with ages ranging from 10 to 13 (M =11.65; SD = .51). Of these students, 27 were in the high VHGTL group and 23 were in the low VHGTL group.
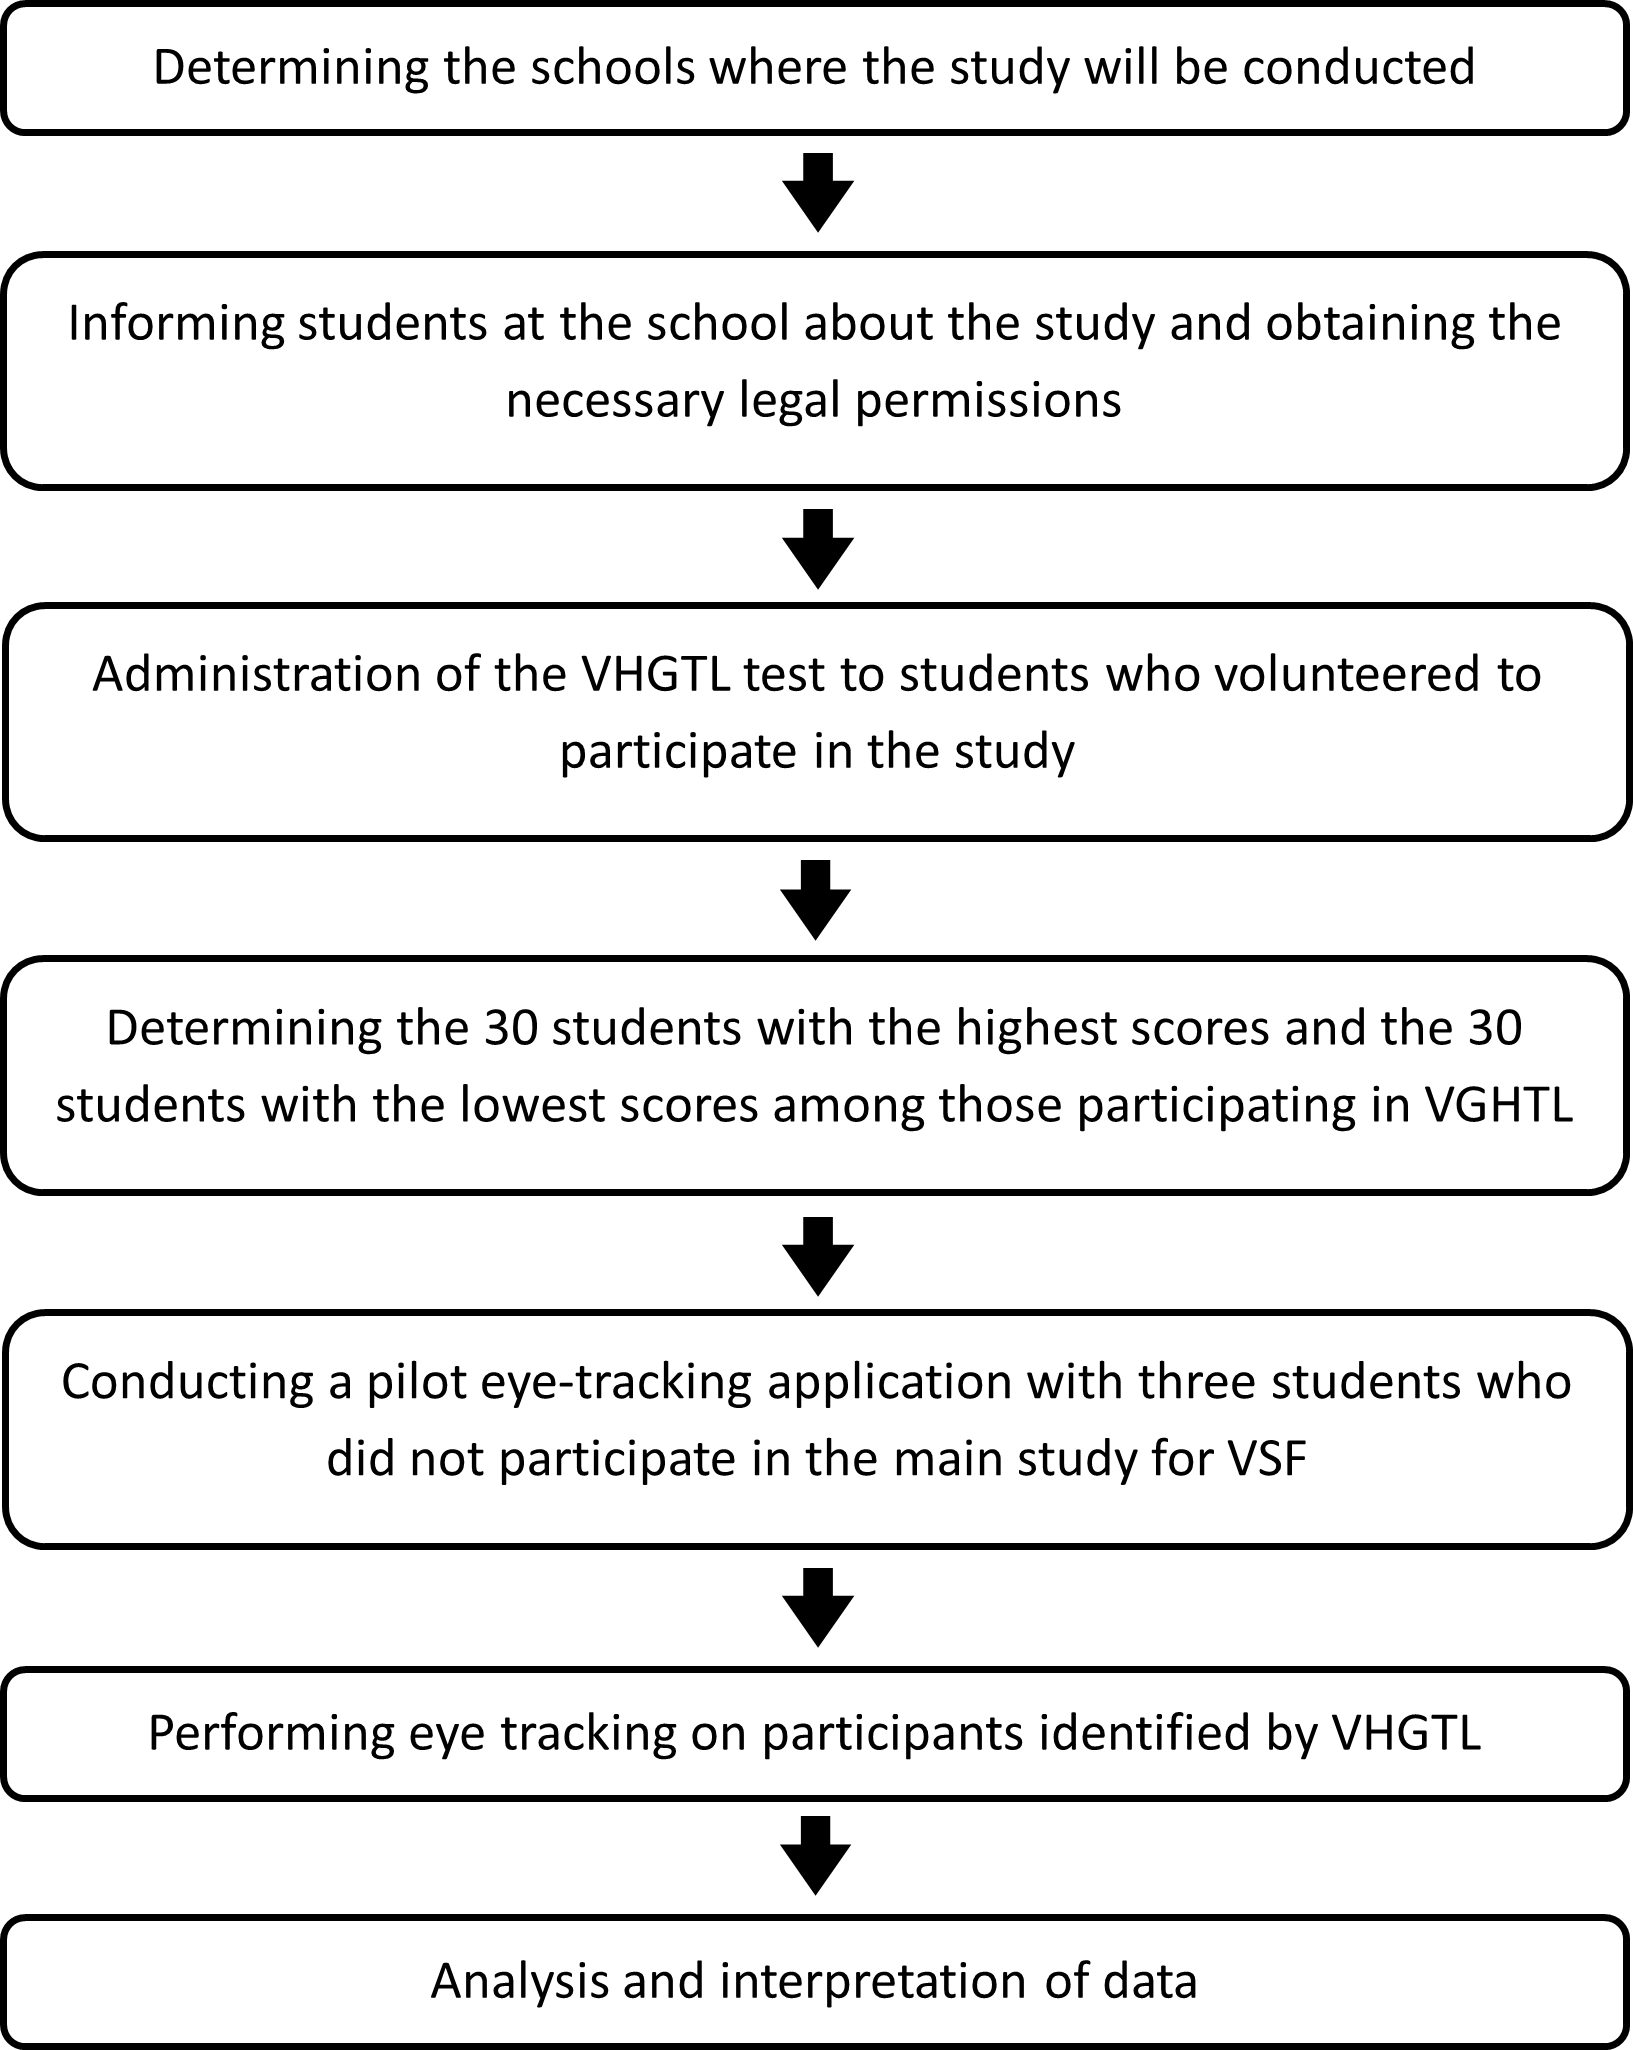
To select these participants, the VHGTL Test was previously administered to 196 students. Based on their scores, the 30 highest- and 30 lowest-scoring students were invited to participate in the second phase, which involved an eye-tracking procedure. This approach was used to maximize the variability in geometric thinking abilities between the high and low VHGTL groups, which allowed for significant differences in eye-tracking behaviors to be more effectively detected. Following this, students who failed the eye-tracking calibration or chose not to participate were excluded from the sample, resulting in the final group of 50 participants.
Instruments
Van Hiele geometric thinking levels test
In line with the purpose of the study, the VHGTL Test was used to select participants for data collection. This 25-item multiple-choice test, originally developed by and adapted into Turkish by , assesses five levels of geometric thinking, with five items per level. Usiskin reported reliability coefficients of .39, .55, .56, .56, .30, and .26 for the test, while Duatepe calculated reliability values of .82, .51, .51, .70, .72, and .59, respectively.
Visual stimuli form
The Visual Stimuli Form (VSF) developed by researchers was used during the eye-tracking procedure. Each item in the form contained a pair of rectangles, either with equal or different areas, presented against a background from a specific color group. The colors used for the backgrounds and rectangle pairs were classified into three types: warm, cold, and neutral. Red and yellow represented warm colors; blue and green represented cold colors; and white represented neutral. Some example items of the rectangle pairs used in VSF are given in Figure 1.
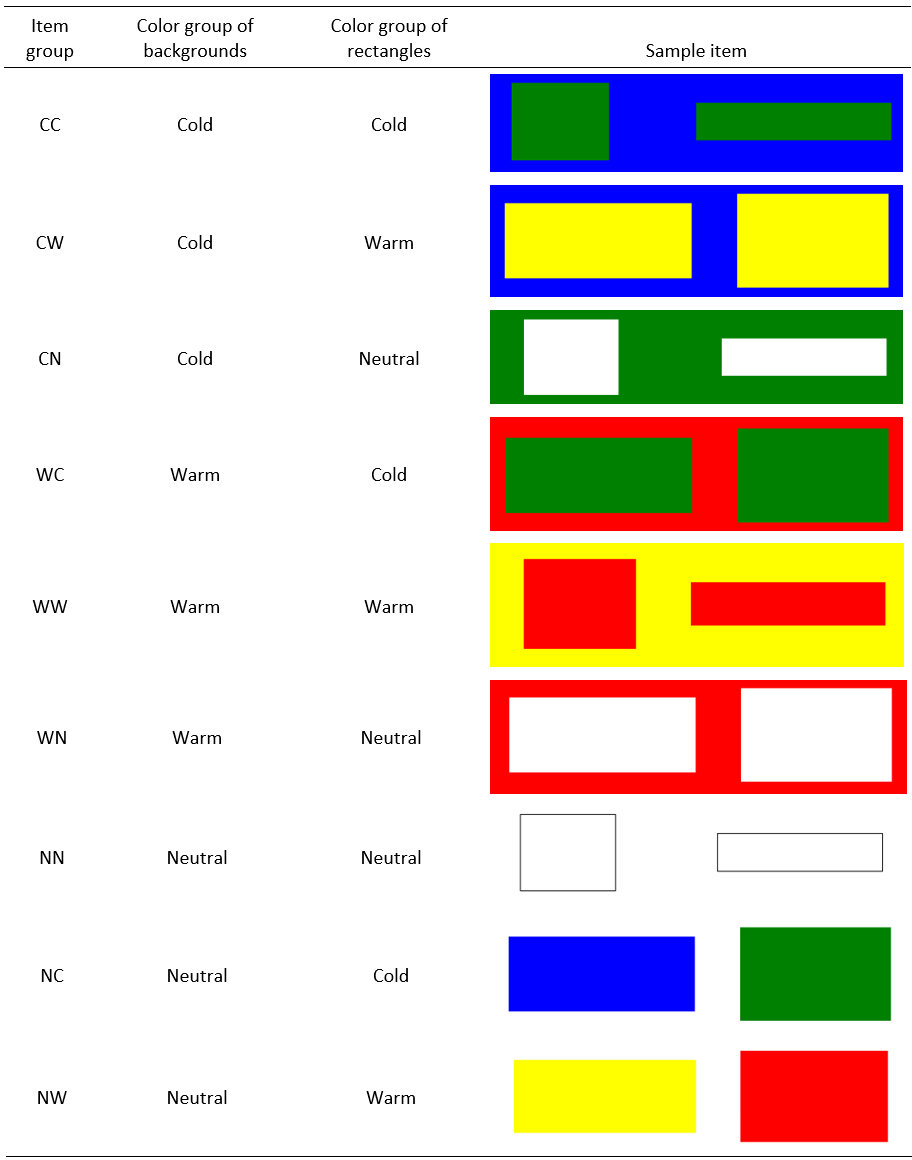
VSF included four items per group: two with equal rectangle areas and two with unequal areas. To prevent easy visual comparison and ensure participants had to process the background and rectangle colors, the difference in area for the unequal pairs was kept between 20% and 25%.
To ensure consistency in color tones, RGB codes were used: 255-255-255 for white, 255-0-0 for red, 255-255-0 for yellow, 0-0-255 for blue, and 0-255-0 for green. The items were coded based on the color types of the background and rectangle pairs. Specifically, "C" was used for cold colors, "W" for warm colors, and "N" for neutral. For example, an item with a cold-colored background and warm-colored rectangles was coded as "CW." In this way, nine distinct item groups were formed.
GazePoint GP3 eye tracker
GazePoint GP3 eye tracker was used to record participants' eye movements. This display-based system operates at a 60 Hz sampling rate with a visual angle accuracy of 0.50 to 1.0 degrees. The device allows for head movement flexibility of up to 25 cm horizontally and 11 cm vertically. The GazePoint Analysis Professional Edition software handled stimulus presentation, calibration, and data collection. A five-point calibration was performed for each participant. The eye tracker was paired with a 19-inch monitor set to a 1440 × 900 pixel resolution.
Procedure
The eye-tracking procedure was conducted individually in a quiet, dimly lit school library to minimize distractions. Before the test, each student was briefed on the procedure, and a five-point calibration was performed. A pilot study with three non-participating students determined an eight-second time limit per item. To prevent carryover effects from previous images, a plus sign on a black background was displayed for one second between each item. Participants advanced to the next item by pressing the "space" key at their own pace.
For the main study, items were presented to participants in a fixed but random order. Students were instructed to compare the areas of rectangle pairs perceptually, without performing any calculations, and to state their answers aloud. The average session duration was 164 seconds, with a range of 103 to 264 seconds.
The Visual Stimuli Form (VSF) was created with standardized digital properties, ensuring uniform color and size for all visual elements. Stimuli were organized into nine distinct item groups based on varied background-figure color combinations. Each group had four items, with an equal number of identical and subtly different areas to prevent bias. The magnitude of the area differences was controlled to maintain a consistent level of visual difficulty across all stimuli.
Moreover, the eye-tracking task was conducted individually in a quiet, dimly lit school library to minimize distractions and optimize data quality. Before the task, each participant underwent a five-point calibration to ensure tracking accuracy. Stimuli were presented on a 19-inch monitor (1440 × 900 resolution) using a GazePoint GP3 eye tracker with a 60 Hz sampling rate. Items were shown in a fixed, randomized order to control for potential order effects. A pilot study established an eight-second upper time limit per item. Participants responded verbally at their own pace, and their answers were recorded.
Data analysis
At the conclusion of data collection, three independent variables were extracted for each participant: success, number of fixations, and gaze duration per item group. For the success variable, verbal responses were coded as 1 (correct) or 0 (incorrect), with total success scores calculated for each of the nine item groups. Each item group was analyzed separately for these three variables. Since none of the variables were normally distributed, Friedman's test, the non-parametric equivalent of repeated-measures ANOVA, was used to determine significant differences among the nine item groups. When significant differences were found, Dunn's post-hoc test was applied to identify the specific groups where these differences occurred.
Ethical considerations
This study fully complied with ethical guidelines for human participant research. Official approvals were secured from all relevant institutions, and written informed consent was obtained from the parents of all student participants, who were under 18. Students were fully informed about the research's purpose and how their data would be used. To ensure participant anonymity and confidentiality, no personal identifying information was requested or recorded. Participation was entirely voluntary, and students could withdraw at any time without consequence.
Results
Does success in perceptually comparing rectangle areas differ across item groups among students at different VHGTL groups and grade levels?
Students’ success scores on the Visual Stimuli Form (VSF) were analyzed based on the item groups. The mean rank values obtained from the analysis are presented in Table 1.
According to Table 1, the item group with the lowest success score was WC for students in the low VHGTL group, and NW for both students in the high VHGTL group and 5th-grade students. In contrast, 6th-grade students demonstrated the lowest score in the CW item group, whereas 7th-grade students showed the lowest performance in the WW item group. On the other hand, when the item groups with the highest success scores were examined, it was found that students in the low VHGTL group and 6th-grade students performed best in the CN item group, while students in the high VHGTL group achieved the highest scores in the CC item group. Additionally, both 5th- and 7th-grade students exhibited the highest scores in the NN item group.
According to the results of the Friedman test, only the students in the Low VHGTL group showed a statistically significant difference between the item group scores ( =18.22, p=.02). However, the post-hoc analysis using the Bonferroni correction revealed that none of the pairwise comparisons reached statistical significance (p > .05). Therefore, it was concluded that there was no statistically significant difference between the success scores across item groups for students in the low VHGTL group.
Do the number of fixations during area comparison differ across item groups among students at different VHGTL groups and grade levels?
The number of fixations of the students based on item groups was analyzed, and the mean rank values of the results were provided in Table 2.
According to Table 2, the lowest number of fixations was observed in the CW item group for both the low and high VHGTL groups. Additionally, the low VHGTL group exhibited the highest number of fixations in the CC item group, while the high VHGTL group showed the highest number of fixations in the NN item group. Regarding grade levels, 5th- and 6th-grade students had the highest number of fixations in the CC item group, whereas 7th-grade students exhibited the highest number of fixations in the NN item group. The lowest number of fixations across grade levels was found in different item groups featuring a cold background. However, no statistically significant difference was observed in the number of fixations according to VHGTL and grade levels (p>.05). To clarify, for all student groups, the number of fixations did not demonstrate a significant difference between the item groups.
Do gaze durations during area comparison differ across item groups among students at different VHGTL groups and grade levels?
The gaze durations of different student groups were analyzed based on item groups, and the results were presented in Table 3.
At first glance at Table 3, it is observed that the lowest gaze duration for all student groups was recorded in the NN item group. It was found that students with low VHGTL exhibited the highest values in the CC item group, while students with high VHGTL exhibited the highest values in both the WN and CC item groups, with the WN item group slightly ahead.
When the data were analyzed according to grade levels, a similar pattern was observed: 5th-grade students exhibited the highest values in the CC item group, while 6th-grade students exhibited the highest values in both the WN and CC item groups, with the WN item group again slightly ahead. For 7th-grade students, the highest gaze duration was exhibited in the CN item group, differing from 5th and 6th-grade students, as was the case with the number of fixations. The Friedman test showed that there could be statistically significant differences in the gaze durations of certain groups of items across all groups (p<.001). Dunn's post-hoc test was performed to determine between which item groups these differences occurred, and the results are presented in Table 4. The table shows the test statistics for pairwise comparisons between the reference group NN and other substance groups in each participant group.
| Participant group | Item group | |||||||
|---|---|---|---|---|---|---|---|---|
| NN-CC | NN-CW | NN-CN | NN-WC | NN-WW | NN-WN | NN-NC | NN-NW | |
| 5th grade | -6.33* | -4.38* | -3.65* | -5.84* | -4.87* | -5.42* | -4.87* | -4.08* |
| 6th grade | -6.04* | -4.09* | -5.27* | -5.33* | -5.09* | -6.10* | -3.85* | -4.74* |
| 7th grade | -3.72* | -3.12 | -5.37* | -3.83* | -3.37* | -4.58* | -4.66* | -4.87* |
| Low VHGTL | -6.57* | -4.23* | -5.76* | -6.49* | -5.28* | -6.35* | -4.85* | -5.06* |
| High VHGTL | -6.76* | -5.27* | -5.81* | -5.91* | -5.71* | -6.86* | -5.96* | -6.01* |
According to Table 4, statistically significant differences were observed between the gaze duration of the NN item group and those of all other item groups across all student groups, and it was concluded that all these differences favored the NN item group, which had the lowest gaze duration. However, based on the adjusted significance values obtained through the Bonferroni correction, it was concluded that the only difference between the gaze durations of the NN and CW item groups was not statistically significant only in the 7th-grade student group (adjst. p > .05).
Discussion
Given that colors strongly influence attention and perception (), this study investigated whether the success, number of fixations, and gaze durations of students —at different VHGTL gropus and grade levels— differed when they perceptually compared the areas of rectangle pairs in various item groups based on color combinations.
Success on the VSF did not vary by grade level or VHGTL group, as no statistical difference was found in the number of correctly answered item groups. This suggests that the different color combinations of backgrounds and shapes did not significantly influence students' accuracy in perceiving and discriminating between the areas of rectangles. This finding contradicts Liu et al.'s () assertion that colors can influence perceptual processes. However, despite the lack of statistical significance, some differences were observed. These variations, though not significant, were examined in the context of the background colors and the rectangle pair colors.
The highest success for both VHGTL groups was observed in cold background item groups (CC for the high-level group and CN for the low-level group). Conversely, the lowest success was in the NW item group for the high VHGTL group and the WC group for the low VHGTL group. This suggests that the areas of rectangles were perceived more accurately when presented on a cold background, an observation that aligns with Kamaruzzaman and Zawawi's () finding that neutral colors with cold tones can enhance perception. The higher success on cold-colored backgrounds may be due to the relaxing effect associated with these colors (; ), or their functionality in tasks requiring creativity and association ().
The finding that students were more successful, though not statistically significant, in comparing rectangle areas with a cold background led to several suggestions for educational and instructional design. An analysis of the rectangle colors revealed that success was also higher, though not statistically significant, for items with neutral-colored rectangles across all groups except the high VHGTL group. Conversely, success was lowest for items with warm-colored rectangles in all groups except the low VHGTL group. Findings suggest that neutral colors may enable more accurate perception of area, aligning with Kamaruzzaman and Zawawi's () assertion that neutral colors mixed with cold tones can stimulate perception. In contrast, warm colors appeared to make area perception more difficult. This could be due to a perceptual bias where warm colors, particularly red, are perceived as being closer and larger than they are, which may have reduced the number of correct answers for those items ().
Within the second research problem, a non-statistically significant change in the number of fixations to item groups was observed across different grade levels and VHGTLs. This finding suggests that various color combinations of shapes and backgrounds could affect eye movements (; ). These findings are interpreted in light of existing literature. found that people prefer situations with different color combinations over those with the same colors, suggesting that the difficulty of distinguishing shapes from backgrounds might be a factor. and emphasized that color harmony and contrast affect visual appeal. In this study, color combinations from the same group (e.g., cold-warm or neutral) attracted more attention and a higher number of fixations. However, the lowest number of fixations were observed on cold-colored backgrounds across all student groups. Additionally, fewer fixations were recorded for most students when looking at item groups with warm-colored rectangles. These results are supported by Hurlbert and Ling's () finding that the effects of red differ based on whether it is in the background or foreground.
The highest number of fixations occurred in item groups where the rectangle pairs and background belonged to the same color group, suggesting that it may have been difficult for participants to distinguish the shape from its background. This finding is consistent with research suggesting that distraction increases unnecessary visual searches, leading to a higher number of fixations (); ). Conversely, when gaze durations were examined, the lowest gaze duration was observed in the NN item group across all student groups, a difference that was found to be statistically significant. This result contradicts the conclusion by , who claimed that colored visuals require less cognitive effort and longer processing time than black-and-white ones.
This study found that gaze duration increased on colored images, with objects on cold-colored backgrounds being viewed for longer periods. This indicates that both object and background colors can affect gaze duration (; ). These results align with the finding that gaze is directed towards salient and distinctive features of stimuli (), and color is a crucial element for the identification and discrimination of objects (; ).
Conclusions and implications
The results of this study show that manipulating visual design elements, especially shape-ground color combinations, can significantly affect perceptual judgment and visual attention during area comparison tasks. This is consistent with prior research indicating that colors can direct attention and enhance cognitive processing in multimedia environments (). From a cognitive load theory perspective, these findings underscore the importance of well-designed visual stimuli. Using appropriate contrast and signaling can reduce unnecessary processing, which is particularly beneficial for young students who are still developing their perceptual strategies ().
The findings offer direct, actionable insights into instructional design. While not all differences in fixation values were statistically significant, key numerical variations were identified. An important observation was that the number of fixations increased when the geometric shape and its background were from the same color group. This implies that low color contrast makes perceptual discrimination more difficult and increases cognitive effort. Student success was also noticeably affected by specific color palettes. A trend showed that students were more successful when comparing shapes against cold-colored backgrounds, suggesting these colors may support performance without causing distraction. Conversely, success decreased when the shapes themselves were displayed in warm colors. This could be due to a perceptual illusion where warm colors are perceived as closer and therefore larger (), which can lead to errors in tasks requiring area comparison. Based on these findings, it may be beneficial to use cold colors for backgrounds in instructional materials to potentially support student performance. However, caution should be exercised when using warm colors for shapes, as they can cause perceptual illusions and increase error rates. Lastly, it is important to remember that color isn't always a necessary element; for certain tasks, simple and clear black-and-white designs can also be highly effective and processed quickly.
The association of warm colors with lower success, though not statistically significant, suggests their potential to create perceptual illusions. In mathematics education, this could pose a problem, as tasks assessing geometric understanding, such as comparing areas, should be independent of color-induced biases. Therefore, it is recommended that instructional designers and teachers avoid using warm colors for objects in assessment tasks that require area comparisons. Additionally, the results emphasize the importance of shape-ground contrast. The increase in fixations caused by low-contrast combinations may indicate visual attention distraction and an increased cognitive load for the student (; ).
Contrary to the common assumption that color always simplifies tasks, the finding that it increases gaze durations offers an important perspective for educators and instructional designers. This suggests that color is not merely an attention-grabbing tool but an element that requires deeper cognitive processing. Therefore, the use of color should be purposeful and aligned with pedagogical goals. While simple black-and-white worksheets may be more efficient for quick computational tasks, carefully designed colors can be used to direct attention and increase engagement.
The results of the study showed that NN items were processed quickly and that colored items prolonged processing time. Future studies may focus on distinguishing whether this increased viewing time represents deeper cognitive processing or distraction. Additionally, the potential of cold backgrounds to enhance success and the risk of warm-colored figures creating perceptual illusions, as observed in this study, can be statistically compared in studies with larger and more diverse samples.
In conclusion, this study showed that color combinations alone do not have a statistically significant overall effect on student achievement, but that the effect of color is highly contextual. At the practical level, the findings reveal that shape-ground contrast is a fundamental requirement for ensuring perceptual clarity and minimizing cognitive load. A notable theoretical finding is that color does not always reduce cognitive effort. Indeed, a significant finding of the study is that the fastest processing time was measured in NN images, and the presence of color increased processing time. This suggests that color may encourage deeper interaction rather than simplifying the cognitive process. Ultimately, this study emphasizes that color is not a universal solution in educational materials but rather a powerful tool whose effect must be carefully managed depending on the context (background, shape, contrast).
Limitations and suggestions
This study has several limitations that should be considered. First, due to the small sample size and the non-normal distribution of the data, non-parametric statistical tests were used. While these tests were appropriate, they may lack the statistical power of parametric tests, which could have yielded more robust and generalizable results had a larger sample been available.
Second, the study's design used a fixed set of visual stimuli with prototype rectangles and controlled color combinations. This approach, while ensuring internal consistency, limits the ecological validity of the findings. In real-world educational materials, students encounter a wider variety of shapes and more complex visual contexts. Future studies should include a broader range of shapes and intermediate or blended colors to better simulate authentic learning environments.
Thirdly, only a limited set of eye-tracking metrics (fixation counts and gaze durations) were used. While these provide valuable information about attention, they offer only a partial view of cognitive processes. Future research should incorporate additional indicators such as time to first fixation, fixation duration, revisits, and saccade lengths to gain more comprehensive insights.
Moreover, study includes its homogeneous sample of similarly aged middle school students, which may have contributed to the lack of significant differences between subgroups. Future research with a wider age range —from primary to high school— could reveal more pronounced developmental and perceptual differences.
Additionally, the study did not collect biometric data (e.g., facial expressions, heart rate) to assess participants' emotional or affective engagement. As affective factors can influence academic outcomes, with positive environments enhancing self-efficacy (), and affective comfort improving spatial skills (), future studies should incorporate such data to understand how emotional states might influence the estimation of geometric shape areas.
Finally, the research used a purely quantitative approach, which limited the depth of contextual understanding. Future studies could adopt a mixed-methods approach, including qualitative data like students’ verbal reports or gaze path analyses, to gain richer insights into how learners process visual stimuli.
References
1
ABREU-MENDOZA, Roberto A.; & ARIAS-TREJO, Natalia (2015). Numerical and area comparison abilities in Down syndrome. Research in Developmental Disabilities, 41-42, 58-65. https://doi.org/10.1016/j.ridd.2015.05.008
2
ALQASSAB, Maryam; STRIJBOS, Jan-Willem; & UFER, Stefan (2018). The impact of peer solution quality on peer-feedback provision on geometry proofs: Evidence from eye-movement analysis. Learning and Instruction, 58, 182-192. https://doi.org/10.1016/j.learninstruc.2018.07.003
3
ANDRÁ, Chiara; LINDSTRÖM, Paulina; ARZARELLO, Ferdinando; HOLMQVIST, Kenneth; ROBUTTI, Ornella; & SABENA, Cristina (2015). Reading mathematics representations: An eye-tracking study. International Journal of Science and Mathematics Education, 13(S2), 237-259. https://doi.org/10.1007/s10763-013-9484-y
4
ATAGI, Natsuki; DEWOLF, Melissa; STIGLER, James W.; & JOHNSON, Scott P. (2016). The role of visual representations in college students’ understanding of mathematical notation. Journal of Experimental Psychology: Applied, 22(3), 295-304. https://doi.org/10.1037/xap0000090
5
BELLIZZI, Joseph A.; CROWLEY, Ayn E.; & HASTY, Ronald W. (1983). The effects of color in store design. Journal of Retailing, 59(1), 21-45. https://www.academia.edu/1981751/The_effects_of_color_in_store_design
6
BIRREN, Faber (1983). Color and human response. Color Research & Application, 8(2), 75-81. https://doi.org/10.1002/col.5080080204
7
BOLDEN, David; BARMBY, Patrick; RAINE, Stephanie; & GARDNER, Matthew (2015). How young children view mathematical representations: A study using eye-tracking technology. Educational Research, 57(1), 59-79. https://doi.org/10.1080/00131881.2014.983718
8
BOYATZIS, Chris J.; & VARGHESE, Reenu (1994). Children’s emotional associations with colors. The Journal of Genetic Psychology, 155(1), 77-85. https://doi.org/10.1080/00221325.1994.9914760
9
CARTER, Benjamin T.; & LUKE, Steven G. (2020). Best practices in eye tracking research. International Journal of Psychophysiology, 155, 49-62. https://doi.org/10.1016/j.ijpsycho.2020.05.010
10
CHUMACHENKO, Dimitry; SHVARTS, Anna; DRENEVA, Anna; & KRICHEVETS, Anatoly (2025). Eye movements in the development of geometric shape recognition: From sensory-motor processes to theoretical perception. Educational Studies in Mathematics, 118(3), 529-554. https://doi.org/10.1007/s10649-024-10298-5
11
CHVÁTAL, Roman; SLEZÁKOVÁ, Jana; & POPELKA, Stanislav (2024). Analysis of problem-solving strategies for the development of geometric imagination using eye-tracking. Education and Information Technologies, 29(10), 12969-12987. https://doi.org/10.1007/s10639-023-12395-z
12
ÇUKUR, Duygu; & GÜLLER-DELICE, Ebru (2011). Erken çocukluk döneminde görsel algı gelişimine uygun mekan tasarımı [Spatial design suitable for the development of visual perception in early childhood]. Aile ve Toplum, 7(24), 25-36. https://dergipark.org.tr/tr/pub/spcd/issue/21097/227207
13
DEWOLF, Tinne; VAN DOOREN, Wim; HERMENS, Frouke; & VERSCHAFFEL, Lieven (2015). Do students attend to representational illustrations of non-standard mathematical word problems, and, if so, how helpful are they? Instructional Science, 43(1), 147-171. https://doi.org/10.1007/s11251-014-9332-7
14
DUATEPE, Asuman (2000). An investigation on the relationship between van Hiele geometric level of thinking and demographic variables for preservice elementary school teachers. [Master Thesis, Middle East Technical University]. OpenMETU. https://open.metu.edu.tr/handle/11511/2810
15
DUCHOWSKI, Andrew (2017). Eye Tracking Methodology. Springer. https://doi.org/10.1007/978-3-319-57883-5
16
DZULKIFLI, Mariam Adawiah; & MUSTAFAR, Muhammad Faiz (2013). The influence of color on memory performance: A review. The Malaysian Journal of Medical Sciences: MJMS, 20(2), 3-9. https://www.ncbi.nlm.nih.gov/pmc/articles/PMC3743993/
17
GILBERT, Kathy; & SCHLEUDER, Joan (1990). Effects of color and complexity in still photographs on mental effort and memory. Journalism Quarterly, 67(4), 749-756. https://doi.org/10.1177/107769909006700429
18
GNAMBS, Timo; APPEL, Markus; & KASPAR, Kai (2015). The effect of the color red on encoding and retrieval of declarative knowledge. Learning and Individual Differences, 42, 90-96. https://doi.org/10.1016/j.lindif.2015.07.017
19
GOMEZ, Alice; PIAZZA, Manuela; JOBERT, Antoinette; DEHAENE-LAMBERTZ, Ghislaine; & HURON, Caroline (2017). Numerical abilities of school-age children with developmental coordination disorder (DCD): A behavioral and eye-tracking study. Human Movement Science, 55, 315-326. https://doi.org/10.1016/j.humov.2016.08.008
20
GONZÁLEZ, Dominga; & SUEIRO, Encarnación (2017). Color y sexo. Revista de Estudios e Investigación en Psicología y Educación, Extr. (4), 102-105. https://doi.org/10.17979/reipe.2017.0.04.2603
21
GUIBAL, Christophe R. C.; & DRESP, Birgitta (2004). Interaction of color and geometric cues in depth perception: When does "red" mean "near"? Psychological Research, 69(1-2), 30-40. https://doi.org/10.1007/s00426-003-0167-0
22
23
HUANG, Zhibang; & LI, Sheng (2023). Learned low priority of attention after training to suppress color singleton distractor. Attention, Perception, & Psychophysics, 85(3), 814-824. https://doi.org/10.3758/s13414-022-02571-7
24
HURLBERT, Anya; & LING, Y. (2012). Understanding colour perception and preference. In Colour Design (pp. 129-157). Elsevier. https://doi.org/10.1533/9780857095534.1.129
25
IOAN, Silvia; SANDULACHE, Miriam; AVRAMESCU, Sinziana; ILIE, Andrei; NEACSU, Alexandru, ZAGREAN, Leon; & MOLDOVAN, Mihai (2007). Red is a distractor for men in competition. Evolution and Human Behavior, 28(4), 285-293. https://doi.org/10.1016/j.evolhumbehav.2007.03.001
26
KAMARUZZAMAN, Syahrul Nizam; & ZAWAWI, Emma Marinie Ahmad (2010). Employees’ perceptions on color preferences towards productivity in Malaysian office buildings. Journal of Sustainable Development, 3(3), 283-293. https://doi.org/10.5539/jsd.v3n3p283
27
KARACA, Hilmi; ERTEKIN, Erhan; & CAGILTAY, Kursat (2025). Investigating middle school students’ eye movements on the mathematical representations: An eye-tracking study. Education and Information Technologies, 30, 16189-16210. https://doi.org/10.1007/s10639-025-13436-5
28
KWALLEK, Nancy; SOON, Kokyung; & LEWIS, Carol M. (2007). Work week productivity, visual complexity, and individual environmental sensitivity in three offices of different color interiors. Color Research & Application, 32(2), 130-143. https://doi.org/10.1002/col.20298
29
LAI, Meng-Lung; TSAI, Meng-Jung; YANG, Fang-Ying; HSU, Chung-Yuan; LIU, Tzu-Chien; LEE, Silvia Wen-Yu; LEE, Min-Hsien; CHIOU, Guo-Li; LIANG, Jyh-Chong; & TSAI, Chin-Chung (2013). A review of using eye-tracking technology in exploring learning from 2000 to 2012. Educational Research Review, 10, 90-115. https://doi.org/10.1016/j.edurev.2013.10.001
30
LI, Yaying; WANG, Yong; SONG, Fanghao; & LIU, Yan (2024). Assessing gender perception differences in color combinations in digital visual interfaces using eye tracking - The case of HUD. International Journal of Human-Computer Interaction, 40(20), 6591-6607. https://doi.org/10.1080/10447318.2023.2258020
31
LIMA, Diego da Silva; & VENTURA, Dora Fix (2023). A review of experimental task design in psychophysical eye tracking research. Frontiers in Human Neuroscience, 17, Article e1112769. https://doi.org/10.3389/fnhum.2023.1112769
32
LIU, Yang; MA, Weifeng; GUO, Xiang; LIN, Xuefen; WU, Chennan; & ZHU, Tianshui (2021). Impacts of color coding on programming learning in multimedia learning: Moving toward a multimodal methodology. Frontiers in Psychology, 12, Article 773328. https://doi.org/10.3389/fpsyg.2021.773328
33
MASON, Lucia; PLUCHINO, Patrik; TORNATORA, Maria Caterina; & ARIASI, Nicola (2013). An eye-tracking study of learning from science text with concrete and abstract illustrations. The Journal of Experimental Education, 81(3), 356-384. https://doi.org/10.1080/00220973.2012.727885
34
MAUDERER, Michael; FLATLA, David R.; & NACENTA, Migual A. (2016). Gaze-contingent manipulation of color perception. Proceedings of the 2016 CHI Conference on Human Factors in Computing Systems, 5191-5202. https://doi.org/10.1145/2858036.2858320
35
MAYER, Richard E. (2009). Multimedia Learning (2nd ed.). Cambridge University Press. https://doi.org/10.1017/CBO9780511811678
36
MAZLUM, Özge; & MAZLUM, Fehmi Soner (2019). A study on conceptual associations of colors in preschool children. Pegem Eğitim ve Öğretim Dergisi, 9(3), 729-764. https://doi.org/10.14527/pegegog.2019.024
37
MEHTA, Ravi; & ZHU, Rui (2009). Blue or red? Exploring the effect of color on cognitive task performances. Science, 323(5918), 1226-1229. https://doi.org/10.1126/science.1169144
38
MILLER-SINGLEY, Alison T.; & BUNGE, Silvia A. (2018). Eye gaze patterns reveal how we reason about fractions. Thinking & Reasoning, 24(4), 445-468. https://doi.org/10.1080/13546783.2017.1417909
39
NAVALPAKKAM, Vidhya; & ITTI, Laurent (2005). Modeling the influence of task on attention. Vision Research, 45(2), 205-231. https://doi.org/10.1016/j.visres.2004.07.042
40
NUNES, Ana; & MAMEDE, Ema (2021). Orientação espacial no pré-escolar: Lateralidade e posição relativa. Revista de Estudios e Investigación En Psicología y Educación, 8(1), 76-93. https://doi.org/10.17979/reipe.2021.8.1.6712
41
OBERSTEINER, Andreas; & TUMPEK, Christine (2016). Measuring fraction comparison strategies with eye-tracking. ZDM, 48(3), 255-266. https://doi.org/10.1007/s11858-015-0742-z
42
OZCELIK, Erol; KARAKUS, Turkan; KURSUN, Engin; & CAGILTAY, Kursat (2009). An eye-tracking study of how color coding affects multimedia learning. Computers & Education, 53(2), 445-453. https://doi.org/10.1016/j.compedu.2009.03.002
43
PANSE, Anja; ALCOCK, Lara; & INGLIS, Matthew (2018). Reading proofs for validation and comprehension: An expert-novice eye-movement study. International Journal of Research in Undergraduate Mathematics Education, 4(3), 357-375. https://doi.org/10.1007/s40753-018-0077-6
44
POURSAFAR, Z., DEVI, Nandineni Rama, & RODRIGUES, L. L. R. (2016). Evaluation of color and lighting preferences in architects’ offices for enhancing productivity. International Journal of Current Research and Review, 8(3), 1-6. https://ijcrr.com/abstract.php?article_id=337
45
RAYNER, Keith (2009). The 35th Sir Frederick Bartlett Lecture: Eye movements and attention in reading, scene perception, and visual search. Quarterly Journal of Experimental Psychology, 62(8), 1457-1506. https://doi.org/10.1080/17470210902816461
46
SCHINDLER, Maike; & LILIENTHAL, Achim J. (2019). Domain-specific interpretation of eye tracking data: Towards a refined use of the eye-mind hypothesis for the field of geometry. Educational Studies in Mathematics, 101(1), 123-139. https://doi.org/10.1007/s10649-019-9878-z
47
SHE, Linwei; WANG, Zhiguo; TAO, Xiaohui; & LAI, Liqi (2024). The impact of color cues on the learning performance in video lectures. Behavioral Sciences, 14(7), Article e560. https://doi.org/10.3390/bs14070560
48
SHIBASAKI, Masahiro; & MASATAKA, Nobuo (2014). The color red distorts time perception for men, but not for women. Scientific Reports, 4(1), Article e5899. https://doi.org/10.1038/srep05899
49
SHVARTS, Anna; CHUMACHENKO, Dmitry; DRENYOVA, Anna; & KRICHEVETS, Anatoly (2019). From prototypical phenomenon to dynamic functional system: Eye-tracking data on the identification of special quadrilaterals. In Anna Shvarts (Ed.), Proceedings of the PME and Yandex Russian Conference: Technology and Psychology for Mathematics Education (pp. 122-129). HSE.
50
SIMÕES, Inês; & SILVA, José Tomás da (2022). Ansiedade matemática: Uma visão global acerca da sua origem, impacto e possíveis intervenções. Revista de Estudios e Investigación en Psicología y Educación, 9(1), 19-38. https://doi.org/10.17979/reipe.2022.9.1.8691
51
SKULMOWSKI, Alexander (2022). When color coding backfires: A guidance reversal effect when learning with realistic visualizations. Education and Information Technologies, 27(4), 4621-4636. https://doi.org/10.1007/s10639-021-10796-6
52
SKULMOWSKI, Alexander; & REY, Günter Daniel (2018). Realistic details in visualizations require color cues to foster retention. Computers & Education, 122, 23-31. https://doi.org/10.1016/j.compedu.2018.03.012
53
SOLSTAD, Trygve; KASPERSEN, Eivind; & EGGEN, Magnus (2025). Eye movements in conceptual and non-conceptual thinking. Educational Studies in Mathematics, 118(3), 323-338. https://doi.org/10.1007/s10649-024-10358-w
54
SONG, Ziming; LIANG, Xiaowei; WANG, Yongsheng; & YAN, Guoli (2021). Effect of alternating-color words on oral reading in grades 2-5 Chinese children: Evidence from eye movements. Reading and Writing, 34(10), 2627-2643. https://doi.org/10.1007/s11145-021-10164-3
55
STROHMAIER, Anselm R.; MACKAY, Kelsey J.; OBERSTEINER, Andreas; & REISS, Kristina M. (2020). Eye-tracking methodology in mathematics education research: A systematic literature review. Educational Studies in Mathematics, 104(2), 147-200. https://doi.org/10.1007/s10649-020-09948-1
56
TELLIOĞLU, Senanur; & SATICI, Burhan (2022). İç mekanda uygulanan renk tercihinin mekan algisina etkisi [The effect of interior color preference on the perception of space]. İstanbul Ticaret Üniversitesi Teknoloji ve Uygulamalı Bilimler Dergisi, 4(2), 87-95. https://dergipark.org.tr/en/pub/icujtas/issue/64668/899584
57
TÜRKOĞLU, Hacer; & YALÇINALP, Serpil (2024). Investigating problem-solving behaviours of university students through an eye-tracking system using GeoGebra in geometry: A case study. Education and Information Technologies. 29, 15761-15791. https://doi.org/10.1007/s10639-024-12452-1
58
USISKIN, Zalman (1982). Van Hiele levels and achievement in secondary school geometry. CDASSG Project. (ED220288) ERIC. https://eric.ed.gov/?id=ed220288
59
UYGUN, Tugba; GUNER, Pinar; & SIMSEK, Irfan (2024). Examining students’ geometrical misconceptions by eye tracking. International Journal of Mathematical Education in Science and Technology, 55(1), 68-93. https://doi.org/10.1080/0020739X.2022.2101954
60
VAN DER WEIJDEN, Fae Aimée; KAMPHORST, Erica; WILLEMSEN, Robin Hella; KROESBERGEN, Evelyn H.; & VAN HOOGMOED, Anne H. (2018). Strategy use on bounded and unbounded number lines in typically developing adults and adults with dyscalculia: An eye-tracking study. Journal of Numerical Cognition, 4(2), 337-359. https://doi.org/10.5964/jnc.v4i2.115
61
VAN MARLEN, Tim; VAN WERMESKERKEN, Margot; JARODZKA, Halszka; & VAN GOG, Tamara (2018). Effectiveness of eye movement modeling examples in problem solving: The role of verbal ambiguity and prior knowledge. Learning and Instruction, 58, 274-283. https://doi.org/10.1016/j.learninstruc.2018.07.005
62
WANG, Yong; SONG, Fanghao; LIU, Yan; LI, Yaying; & ZHANG, Zihan (2020). Color scheme compensatory evaluation method based on eye movement tracking technology. IEEE Access, 8, 214240-214253. https://doi.org/10.1109/ACCESS.2020.3040495
63
WANG, Zhanzhu; SHEN, Maoting; & HUANG, Yongming (2024). Combining eye-tracking technology and subjective evaluation to determine building facade color combinations and visual quality. Applied Sciences, 14(18), Article 8227. https://doi.org/10.3390/app14188227